🏆 Excellent Award (2nd Prize)
2023 KNU K-Digital Platform Hackathon
📌 Problem Statement
Traditional financial decision-making relies heavily on credit scores and collateral, which often excludes small businesses and certain industries despite having stable or growing sales performance. As a result, financially viable industries may be systematically underserved, while financial institutions lack reliable tools to assess their true repayment capacity.
The core problem addressed in this project is the absence of data-driven, forward-looking indicators that can complement credit-based evaluation. Without accurate industry-level sales forecasting, financial institutions face difficulty in balancing risk control with financial inclusion, leading to conservative lending and missed economic opportunities.
💡 Proposed Solution
This project addresses the limitations of traditional credit-based financing by proposing a sales-driven forecasting framework for industries that face restricted financial access due to low credit scores or insufficient collateral.
The core idea is to leverage industry-level sales time-series forecasting as an alternative decision signal for financial institutions. By accurately predicting future revenue trends, the framework enables:
- Identification of high-potential industries that are financially underserved.
- Data-driven allocation of capital while minimizing credit risk.
- Early detection of risk-prone industries through forecast instability.
This approach supplements conventional credit evaluation with objective, data-backed indicators, allowing financial institutions to expand financing opportunities without compromising risk management.
🛠️ Technical Overview
1) Data & Preprocessing
- Dataset: KB Kookmin Card industry-level sales data (Jan 2020 – Jul 2021)
- Key Variables:
- Year–month index, industry category code, transaction amount
- Business days, weekdays, transaction count, revisit count
- Preprocessing Steps:
- Label encoding of fine-grained industry categories
- Construction of time-series indices
- Missing value handling and normalization
2) Exploratory Data Analysis (EDA)
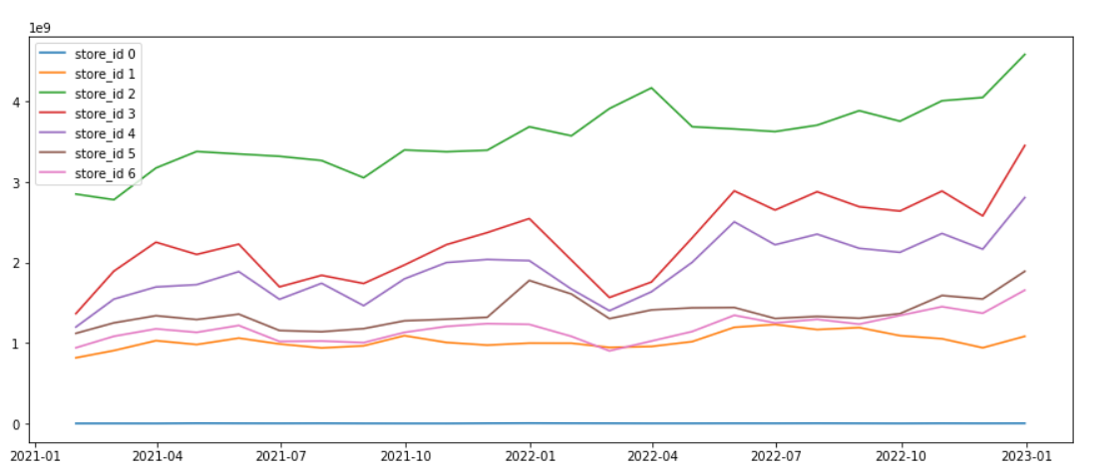
📊 Sales Trends Across Multiple Industries
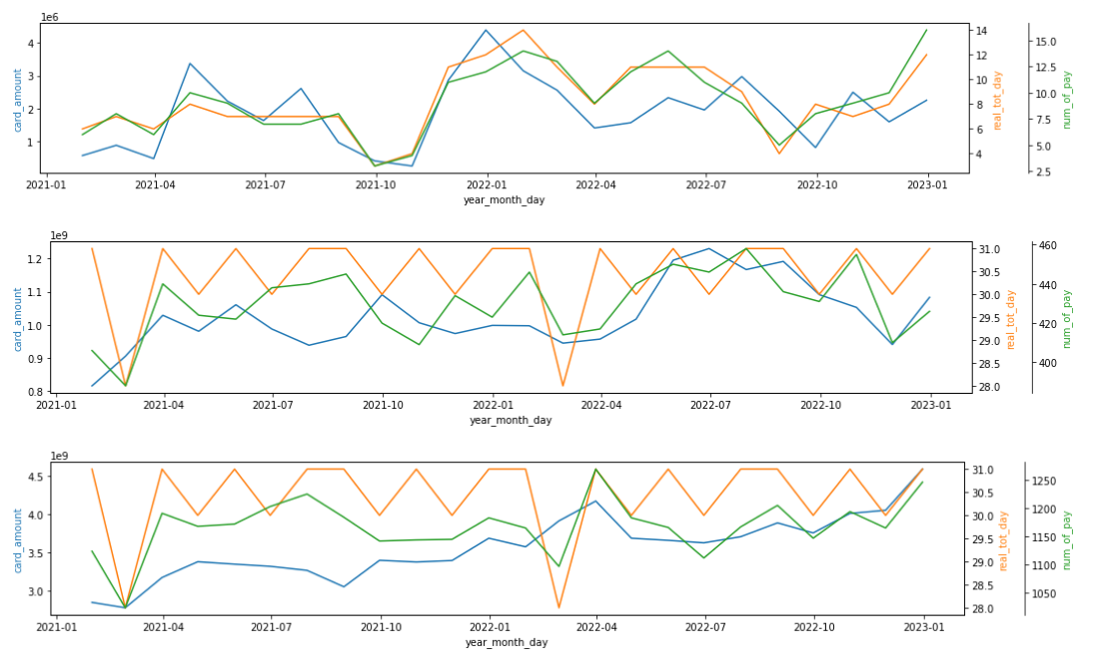
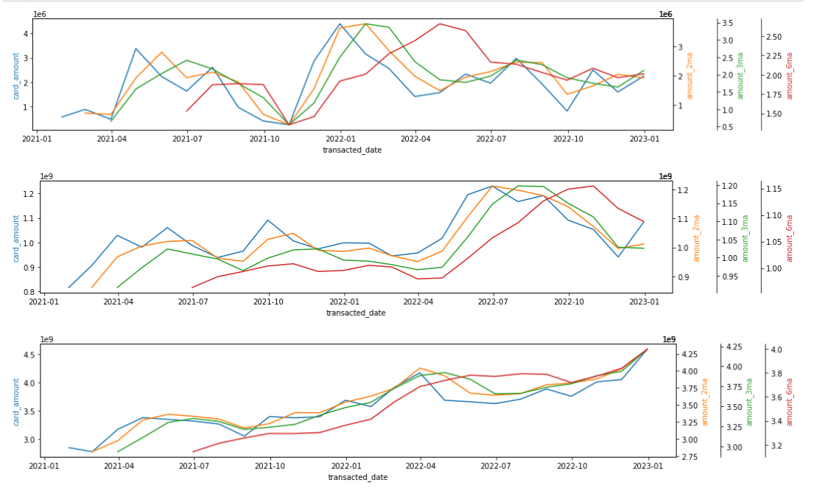
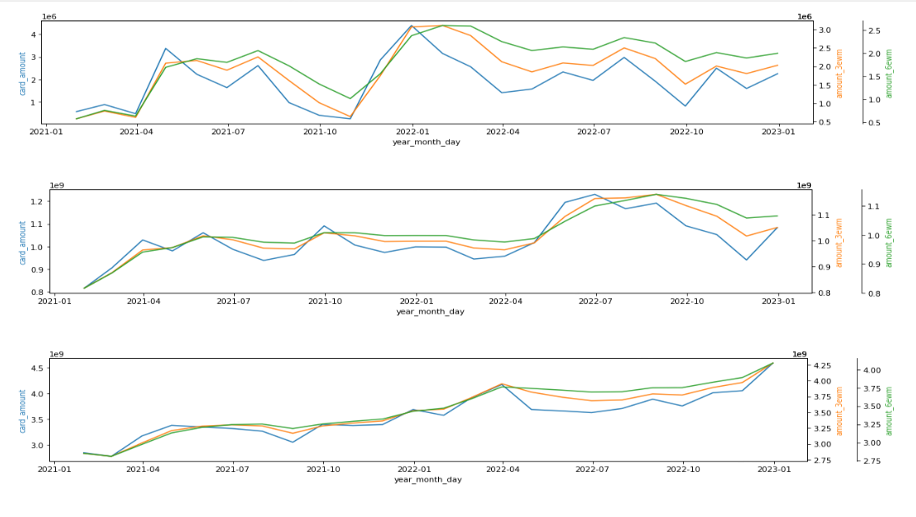
🔎 Pattern Analysis of Variables
- Key Observations:
- Most industries operate 20–30 days per month.
- Transaction count and revisit count exhibit positive skewness.
- While absolute sales volumes differ, overall temporal trends are synchronized.
- Card transaction amounts show strong correlation with operational variables.
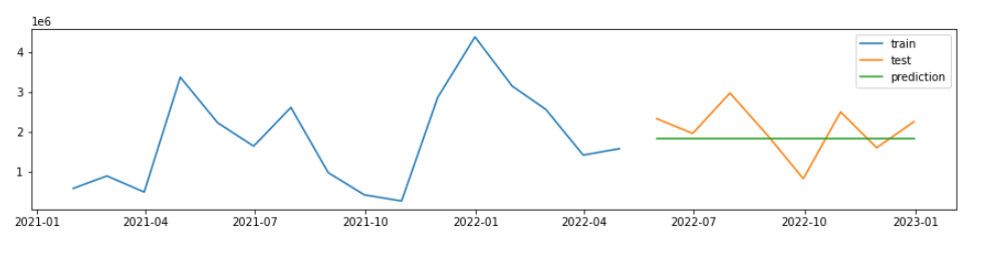
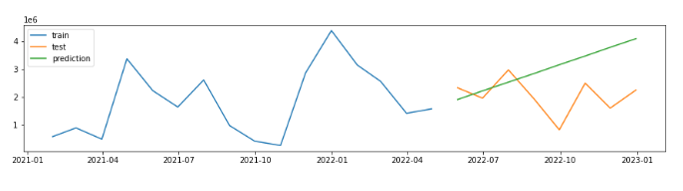
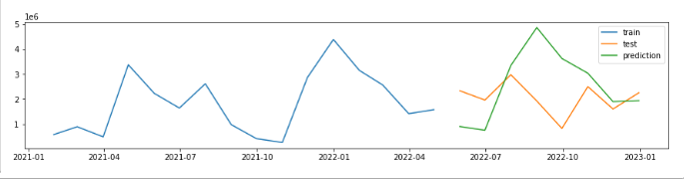
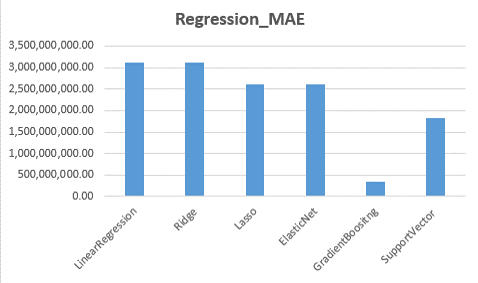
3) Modeling & Evaluation
- Models Evaluated:
- Statistical: Moving Average, Exponential Smoothing (SES, Holt–Winters), ARIMA / ARMA
- Deep Learning: LSTM
- Evaluation Metric: MAE (Mean Absolute Error)
Conclusion: ARIMA demonstrated the most stable performance. It effectively captured both trend and seasonality for the limited industry-level time-series data, whereas LSTM struggled to generalize due to insufficient data volume per industry.
🎬 Results and Achievements
- Technical Feasibility: Constructed a practical time-series forecasting pipeline.
- Social Impact: Proposed alternative indicators for financial inclusion.
- Model Validation: Comprehensive comparison proving ARIMA’s suitability for this specific dataset.
🌱 Expected Impact
- For Financial Institutions: Improved loan approval accuracy & risk assessment.
- For SMEs: Expanded access to financing for underserved industries.
- For Policy: Data-driven foundations for inclusive financial support.
🏅 Award Received
2023 Daegu Financial Competetion