Overview
During the Naver AI Tech 7th (Computer Vision Track), I conducted four major projects ranging from image classification to segmentation. Through this intensive curriculum, I developed expertise in Data-Centric AI, Model Optimization, and MLOps tools (WandB, Poetry).
Below is a summary of the key projects and my specific contributions.
1. Sketch Image Classification (ImageNet-Sketch)
👉 Code
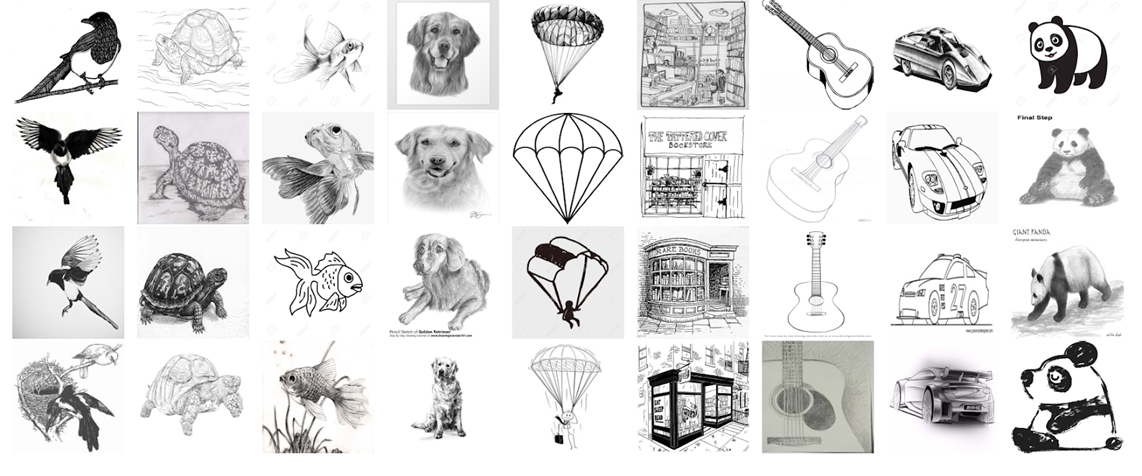
SketchDataSet_Example1
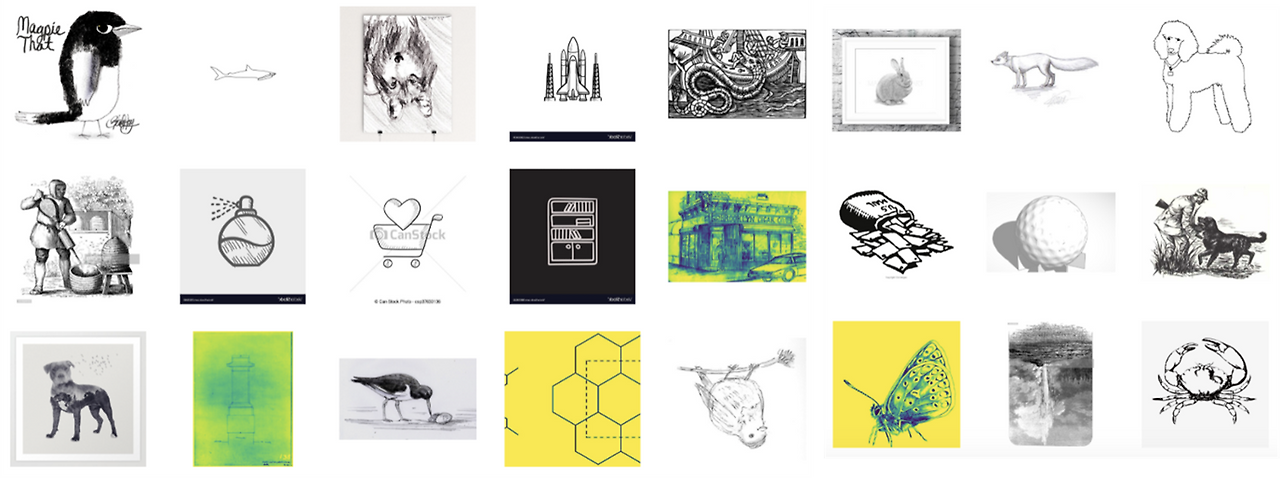
SketchDataSet_Example2
Objective Build a robust baseline image classification model on the ImageNet-Sketch dataset, focusing on improving generalization performance through data-centric strategies.
🎯 My Role:
- Led dataset analysis and data-centric optimization, identifying performance bottlenecks caused by dataset structure rather than model capacity
- Designed and validated data cleaning policies for duplicate and ambiguous samples
- Implemented and evaluated augmentation and preprocessing strategies tailored to sketch-style images
- Managed experiments and hyperparameter searches using Weights & Biases
Approach & Key Solutions
🛠️ Methods:
- Exploratory Data Analysis (EDA)
- Analyzed image count per class and class imbalance
- Identified near-duplicate sketches caused by flips and rotations
- Examined object placement and background patterns to guide preprocessing decisions
- Data Cleaning
- Removed near-duplicate samples dominating certain classes
- Pruned ambiguous samples between visually overlapping classes (e.g., baseball icon vs. baseball player)
- Verified that simple removal outperformed synthetic data generation approaches
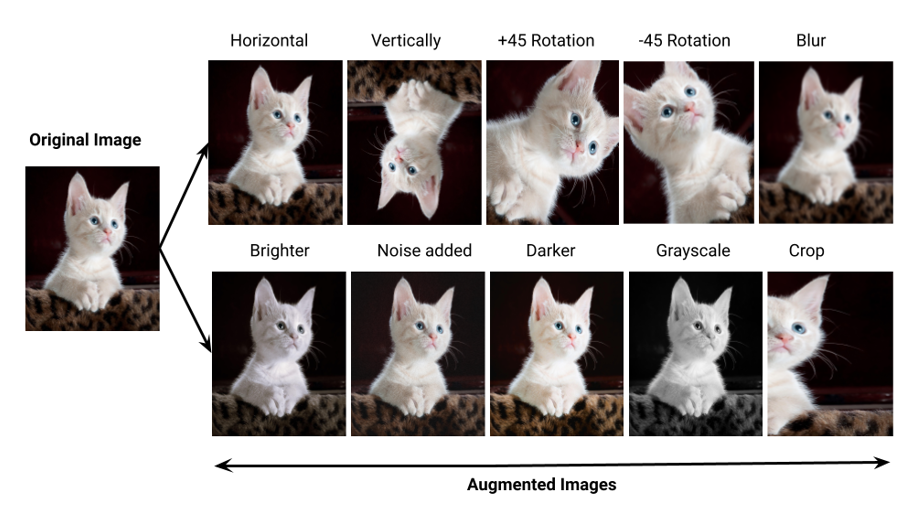
- Targeted Augmentation (Albumentations)
- Avoided Flip/Rotate-heavy augmentations already present in the dataset
- Applied controlled ShiftScaleRotate (wrap mode) to improve spatial robustness
- Used GaussianBlur to reduce overfitting to repeated line patterns
- Empirically confirmed that aggressive augmentations (e.g., CoarseDropout, GridShuffle) degraded performance
- Grayscale-aware Preprocessing
- Identified that ImageNet-Sketch images are inherently grayscale
- Compared:
- Replicating grayscale to 3-channel input
- Modifying pretrained Conv2D weights for single-channel input
- Computed dataset-specific mean and standard deviation for grayscale normalization
- Experiment Management
- Tracked experiments and metrics using WandB
- Performed hyperparameter optimization via WandB Sweeps
- Compared CNN-based and ViT-based models from an inductive bias perspective
📊 Result:
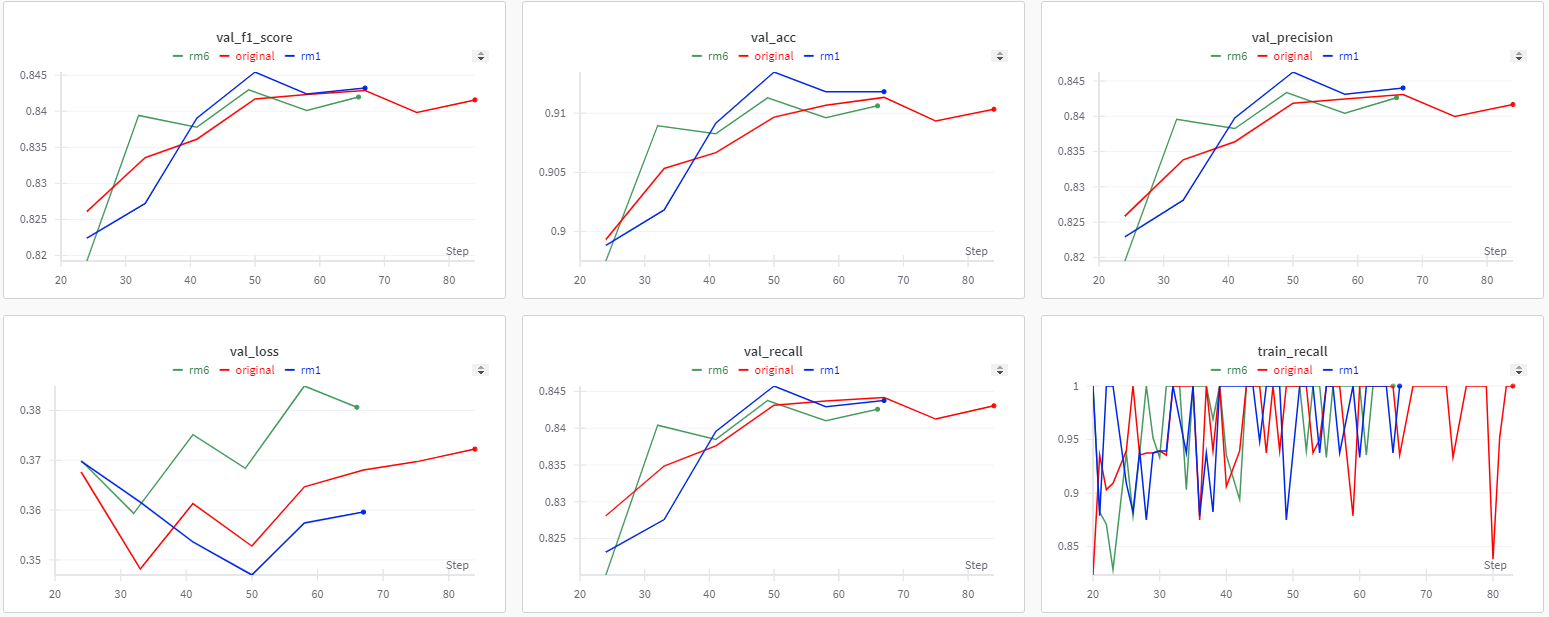
- Achieved up to ~0.92 classification accuracy, outperforming naive augmentation baselines
- Demonstrated that dataset de-duplication and ambiguity removal provided larger gains than architectural changes
- Confirmed that indiscriminate augmentation degrades performance on already-distorted sketch data
Key Insight For sketch-based image classification, data quality and class clarity matter more than model complexity. Removing misleading samples consistently improved generalization, while indiscriminate augmentation led to performance collapse.
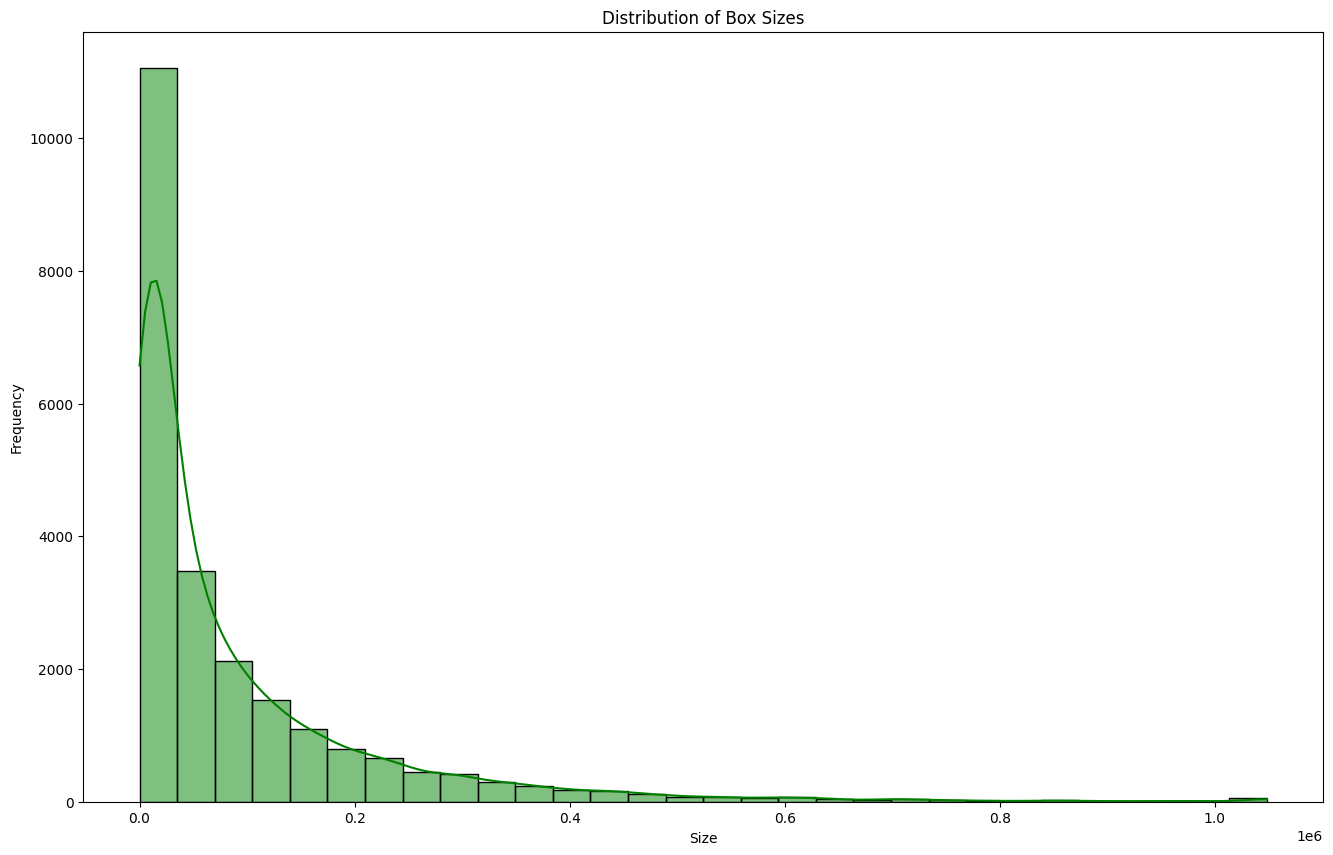
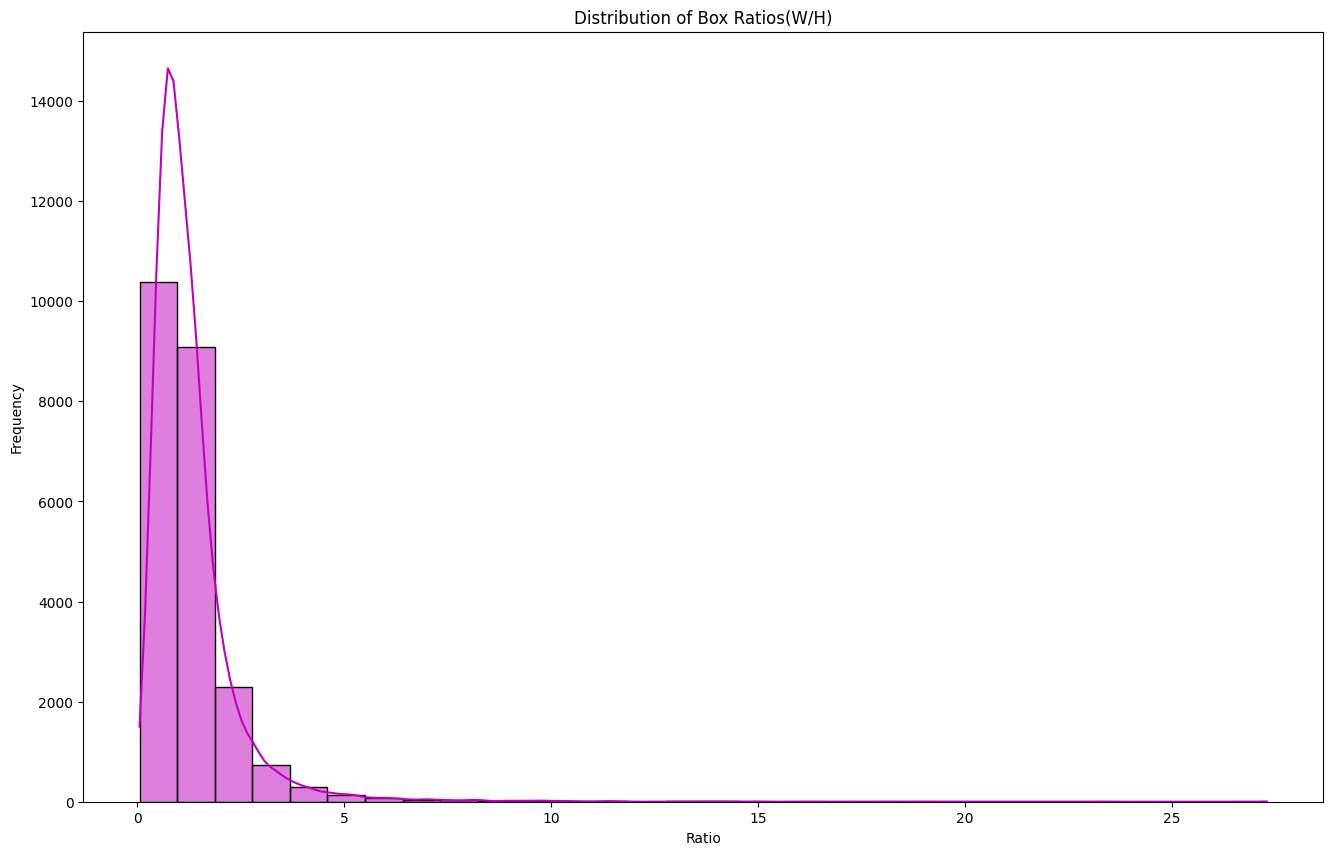
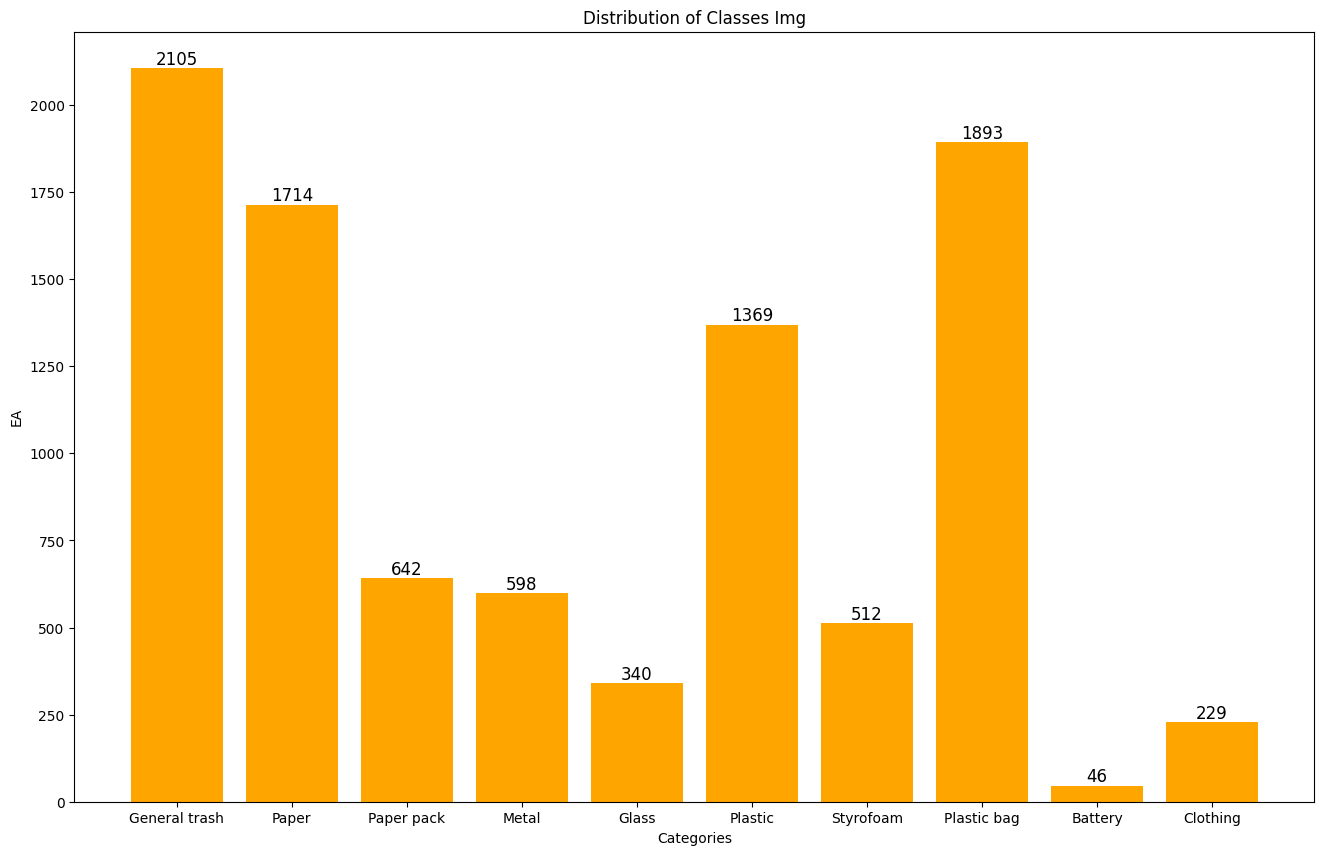
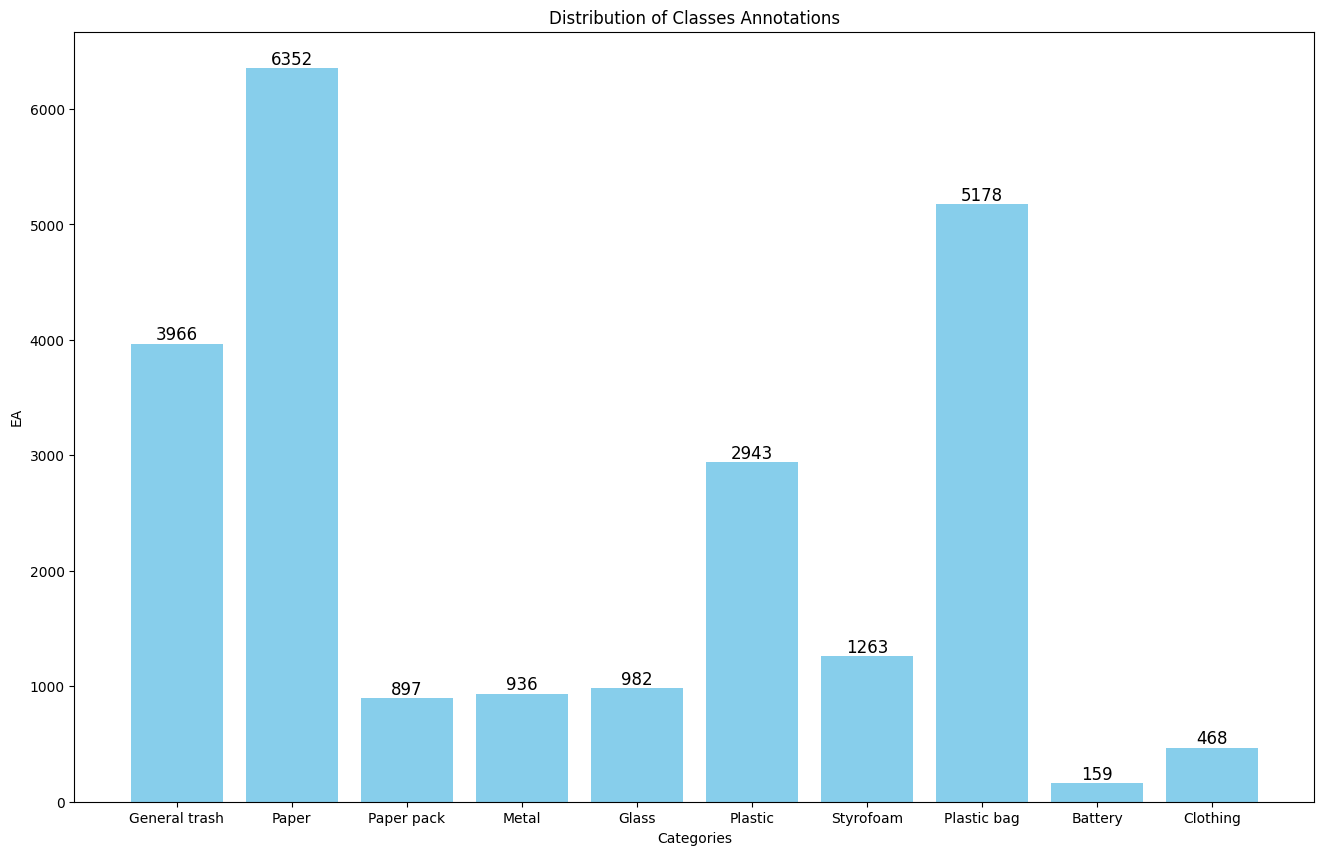
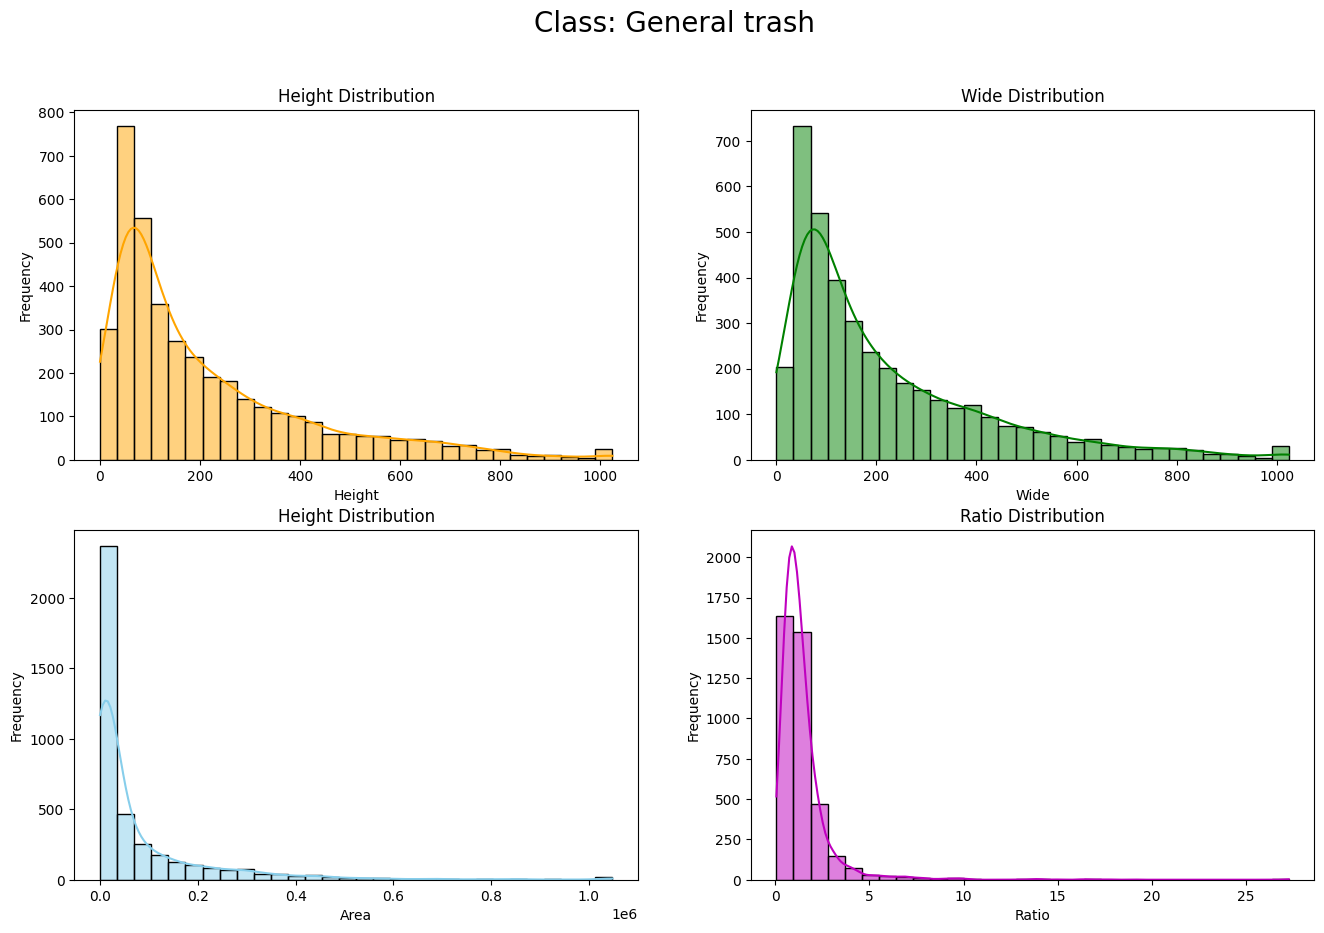
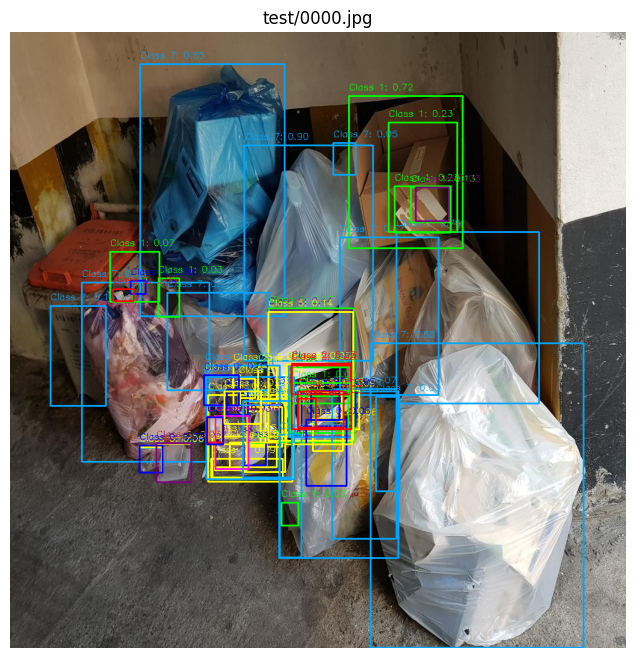
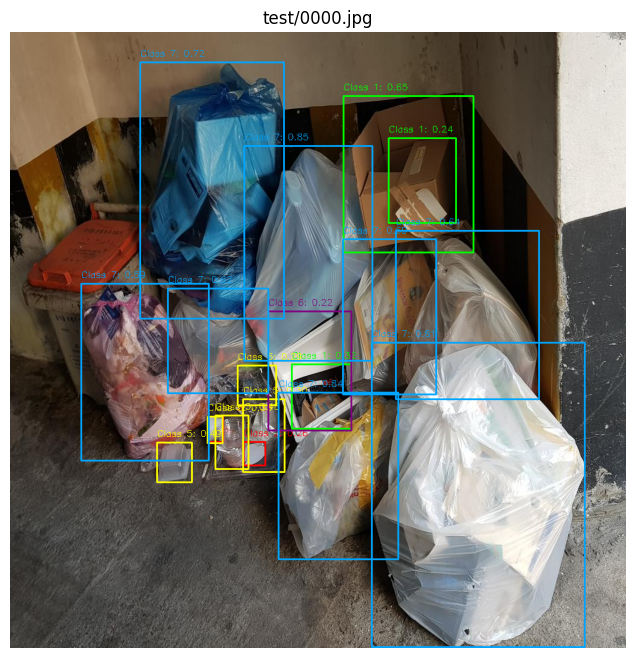
2. Trash Object Detection
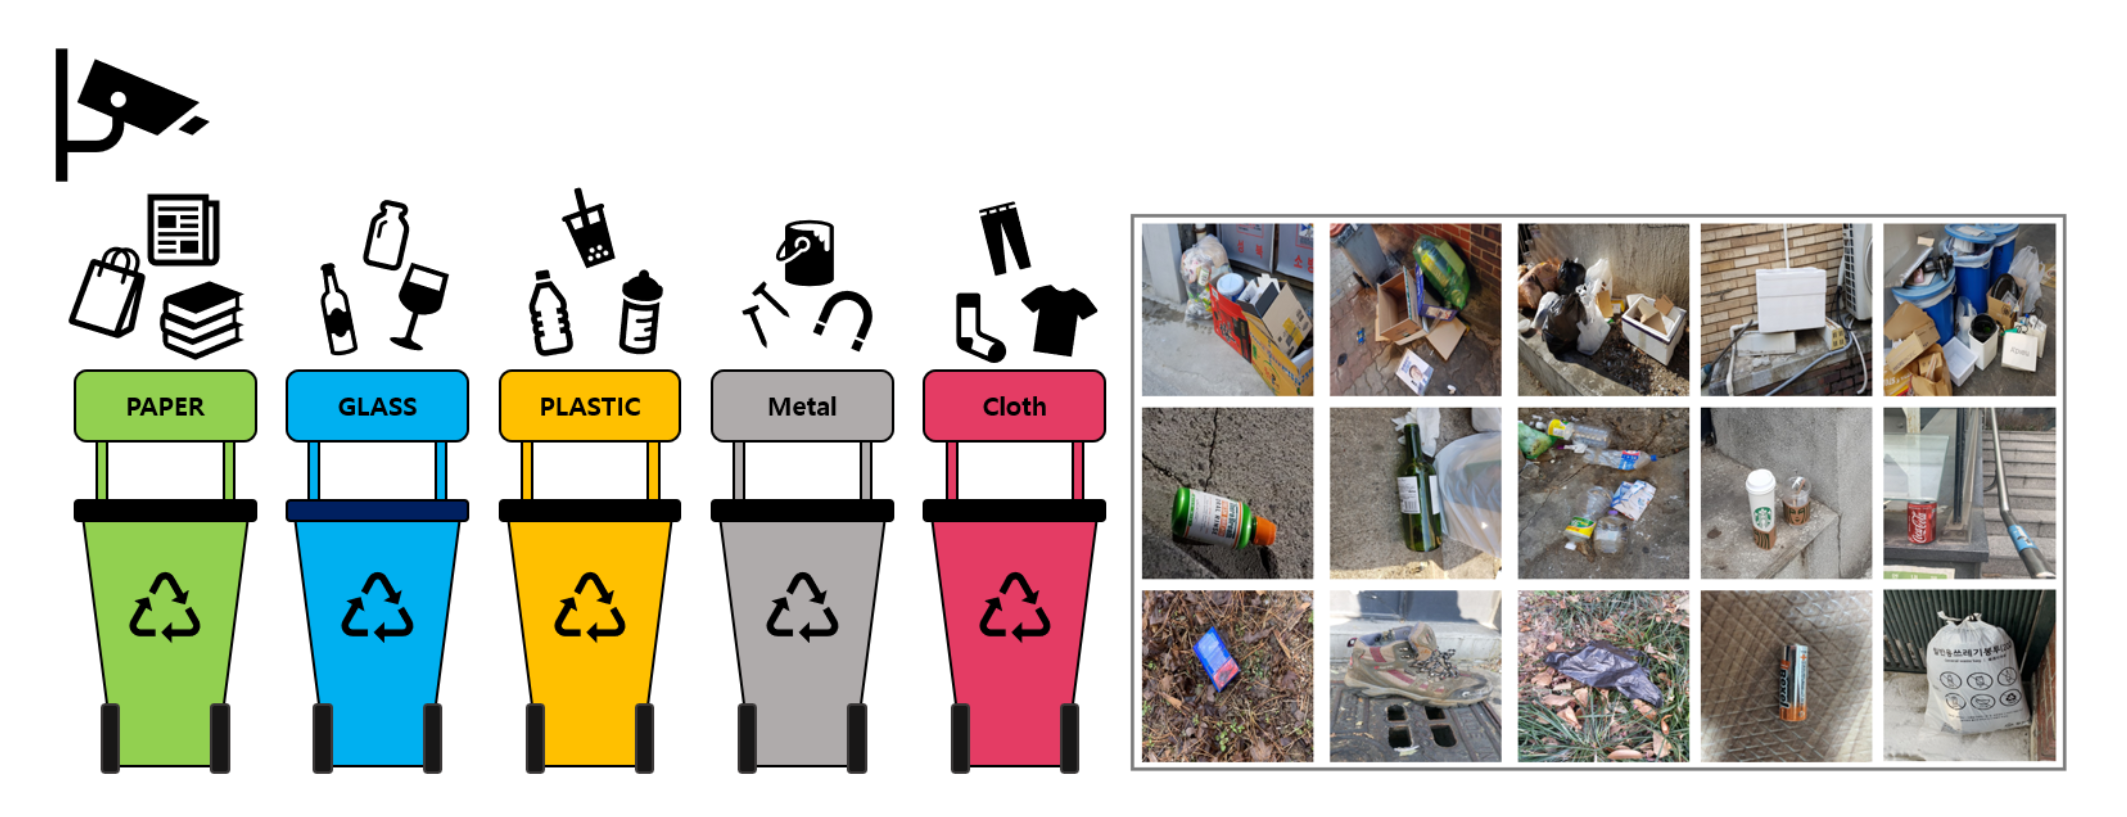
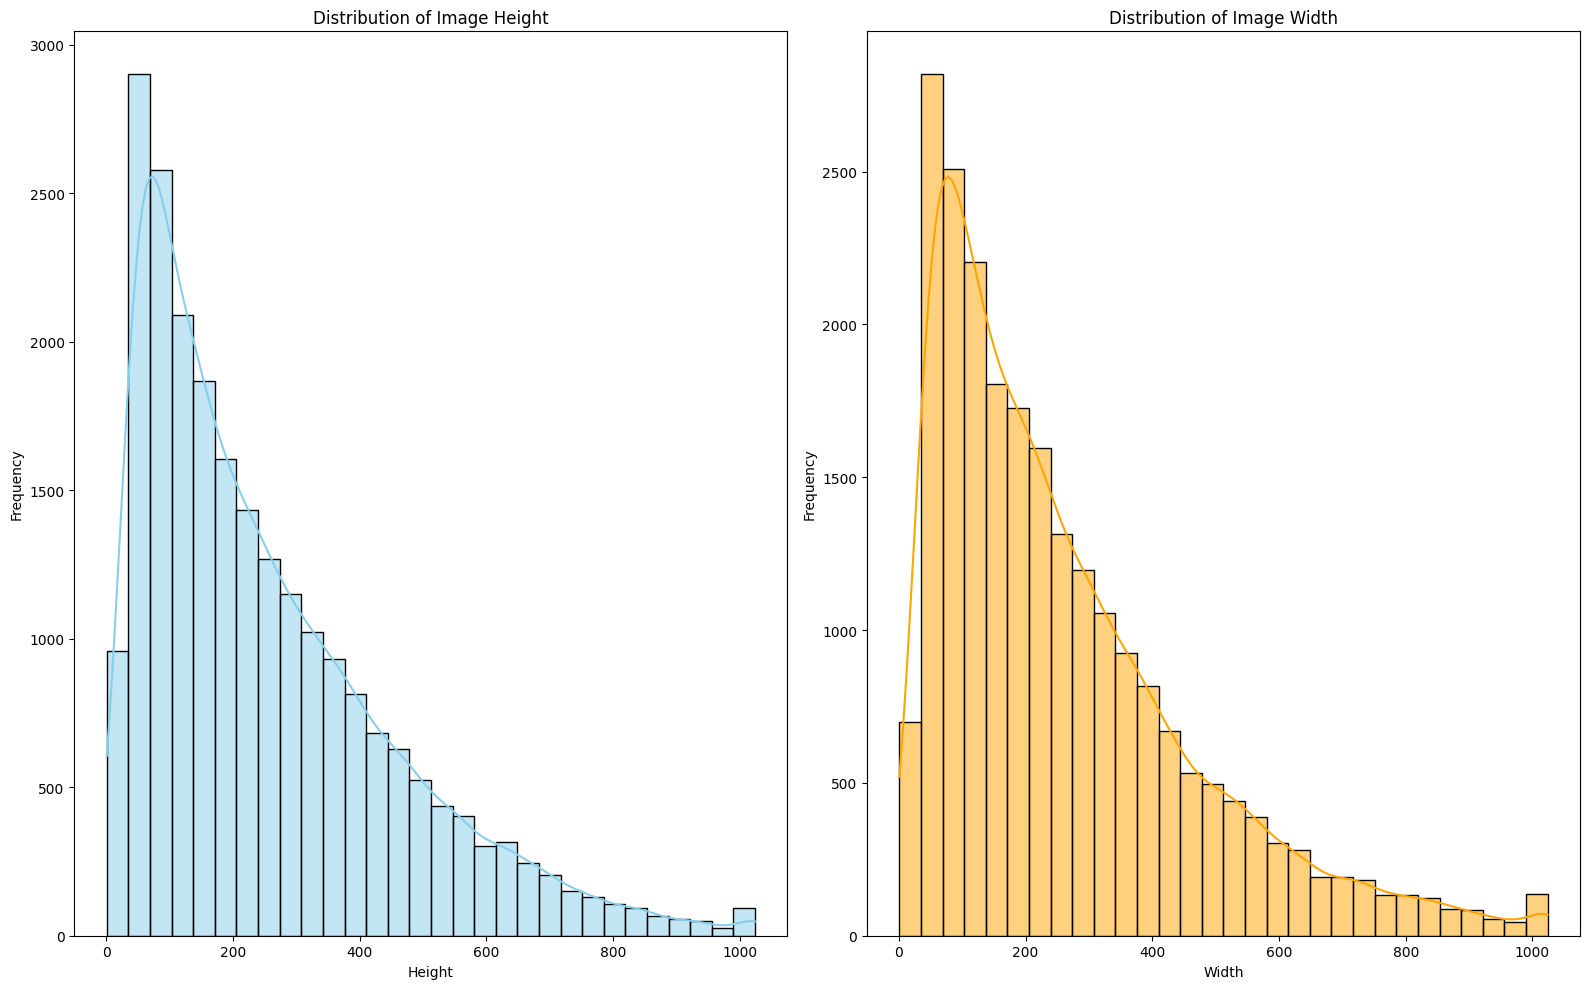
Objective: Detect and classify trash in high-resolution (1024x1024) images into 10 categories.
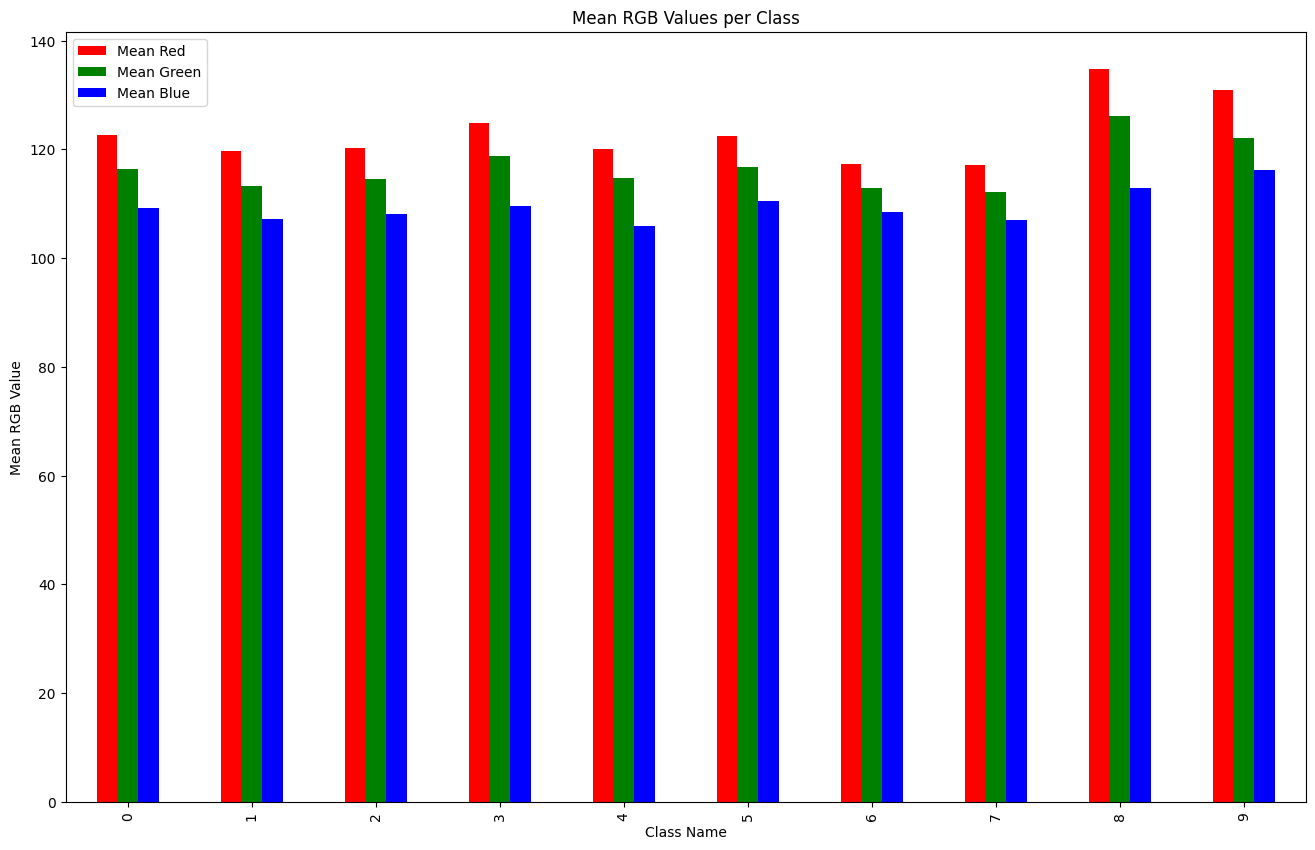
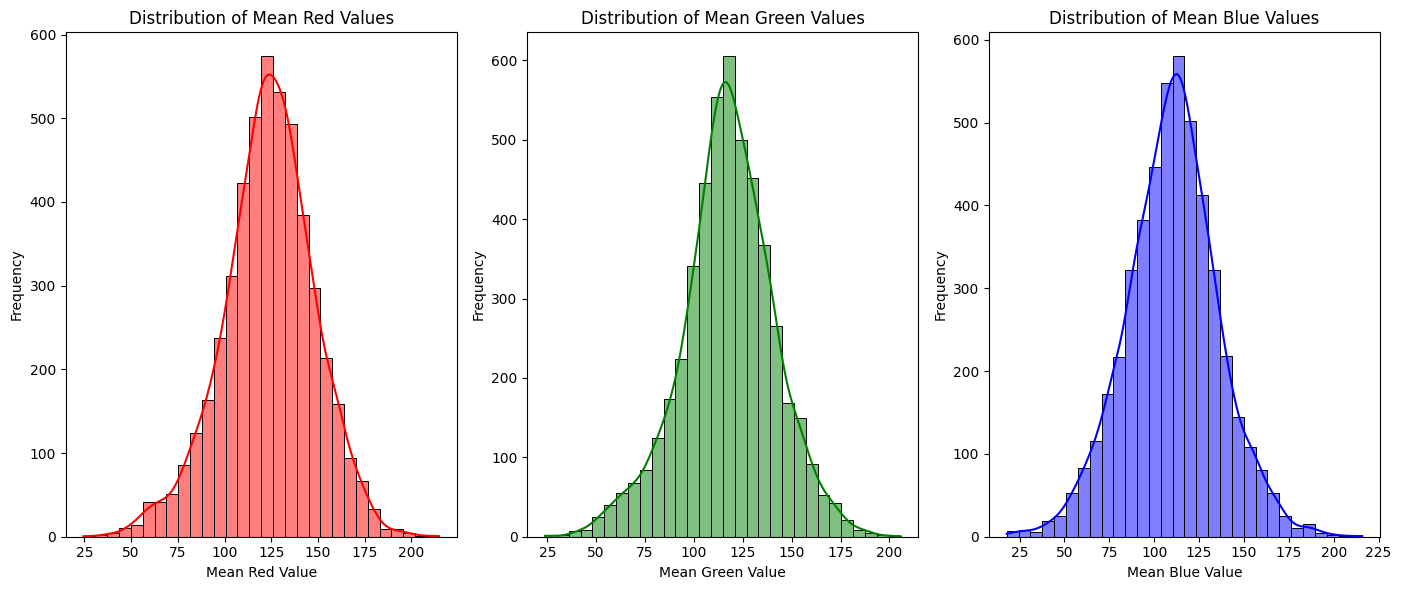
- 🔍 EDA: ① Box ② Class ③ Color
- 🎯 My Role:
- YOLO Implementation: Experimented with YOLOv11 (s, l, xl) models to verify the performance of 1-stage detectors compared to 2-stage models.
- Ensemble Strategy: Contributed to the final ensemble by combining YOLO predictions with the team’s Cascade R-CNN and DINO models.
- 🛠️ Methods:
- Augmentation: Applied Mosaic, MixUp, and RandomCrop to handle object scale variations.
- Ensemble: Used WBF (Weighted Boxes Fusion) and Soft-NMS to merge bounding boxes effectively.
- 📊 Result: Achieved Public Score 0.6714 / Private Score 0.6558.
You can find the detailed experimental results below.


- Summary
Conducted large-scale object detection experiments using YOLOv11 and multi-model ensembles (Cascade R-CNN, DINO), achieving Public 0.6714 / Private 0.6558 through optimized augmentation and bounding-box fusion strategies.
3. Data-Centric: Multilingual Receipt OCR
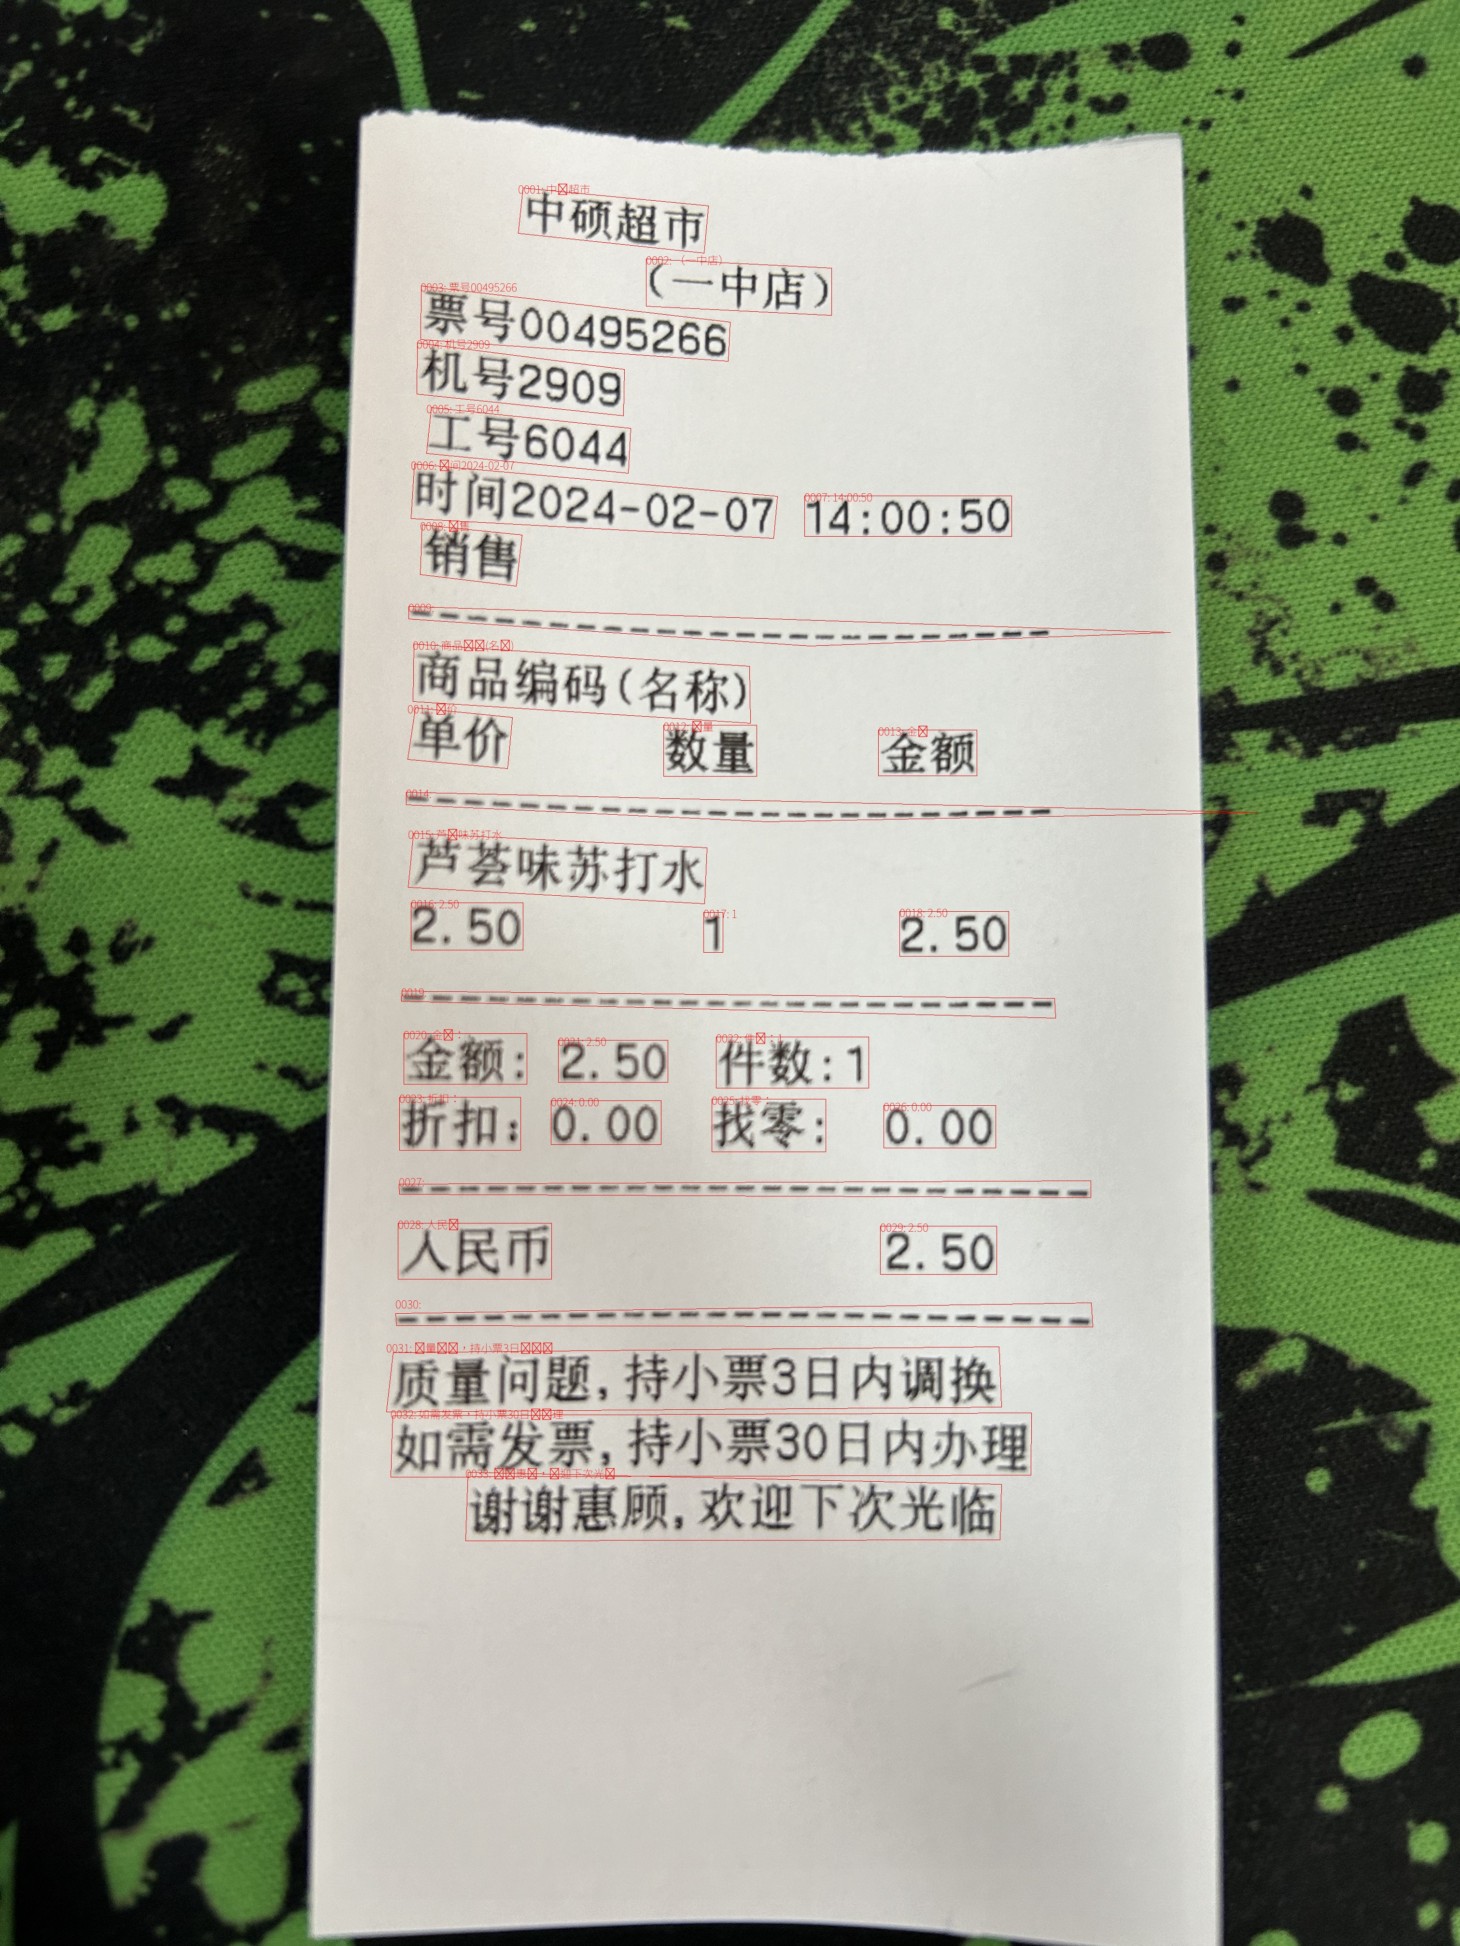
OCR_Example1
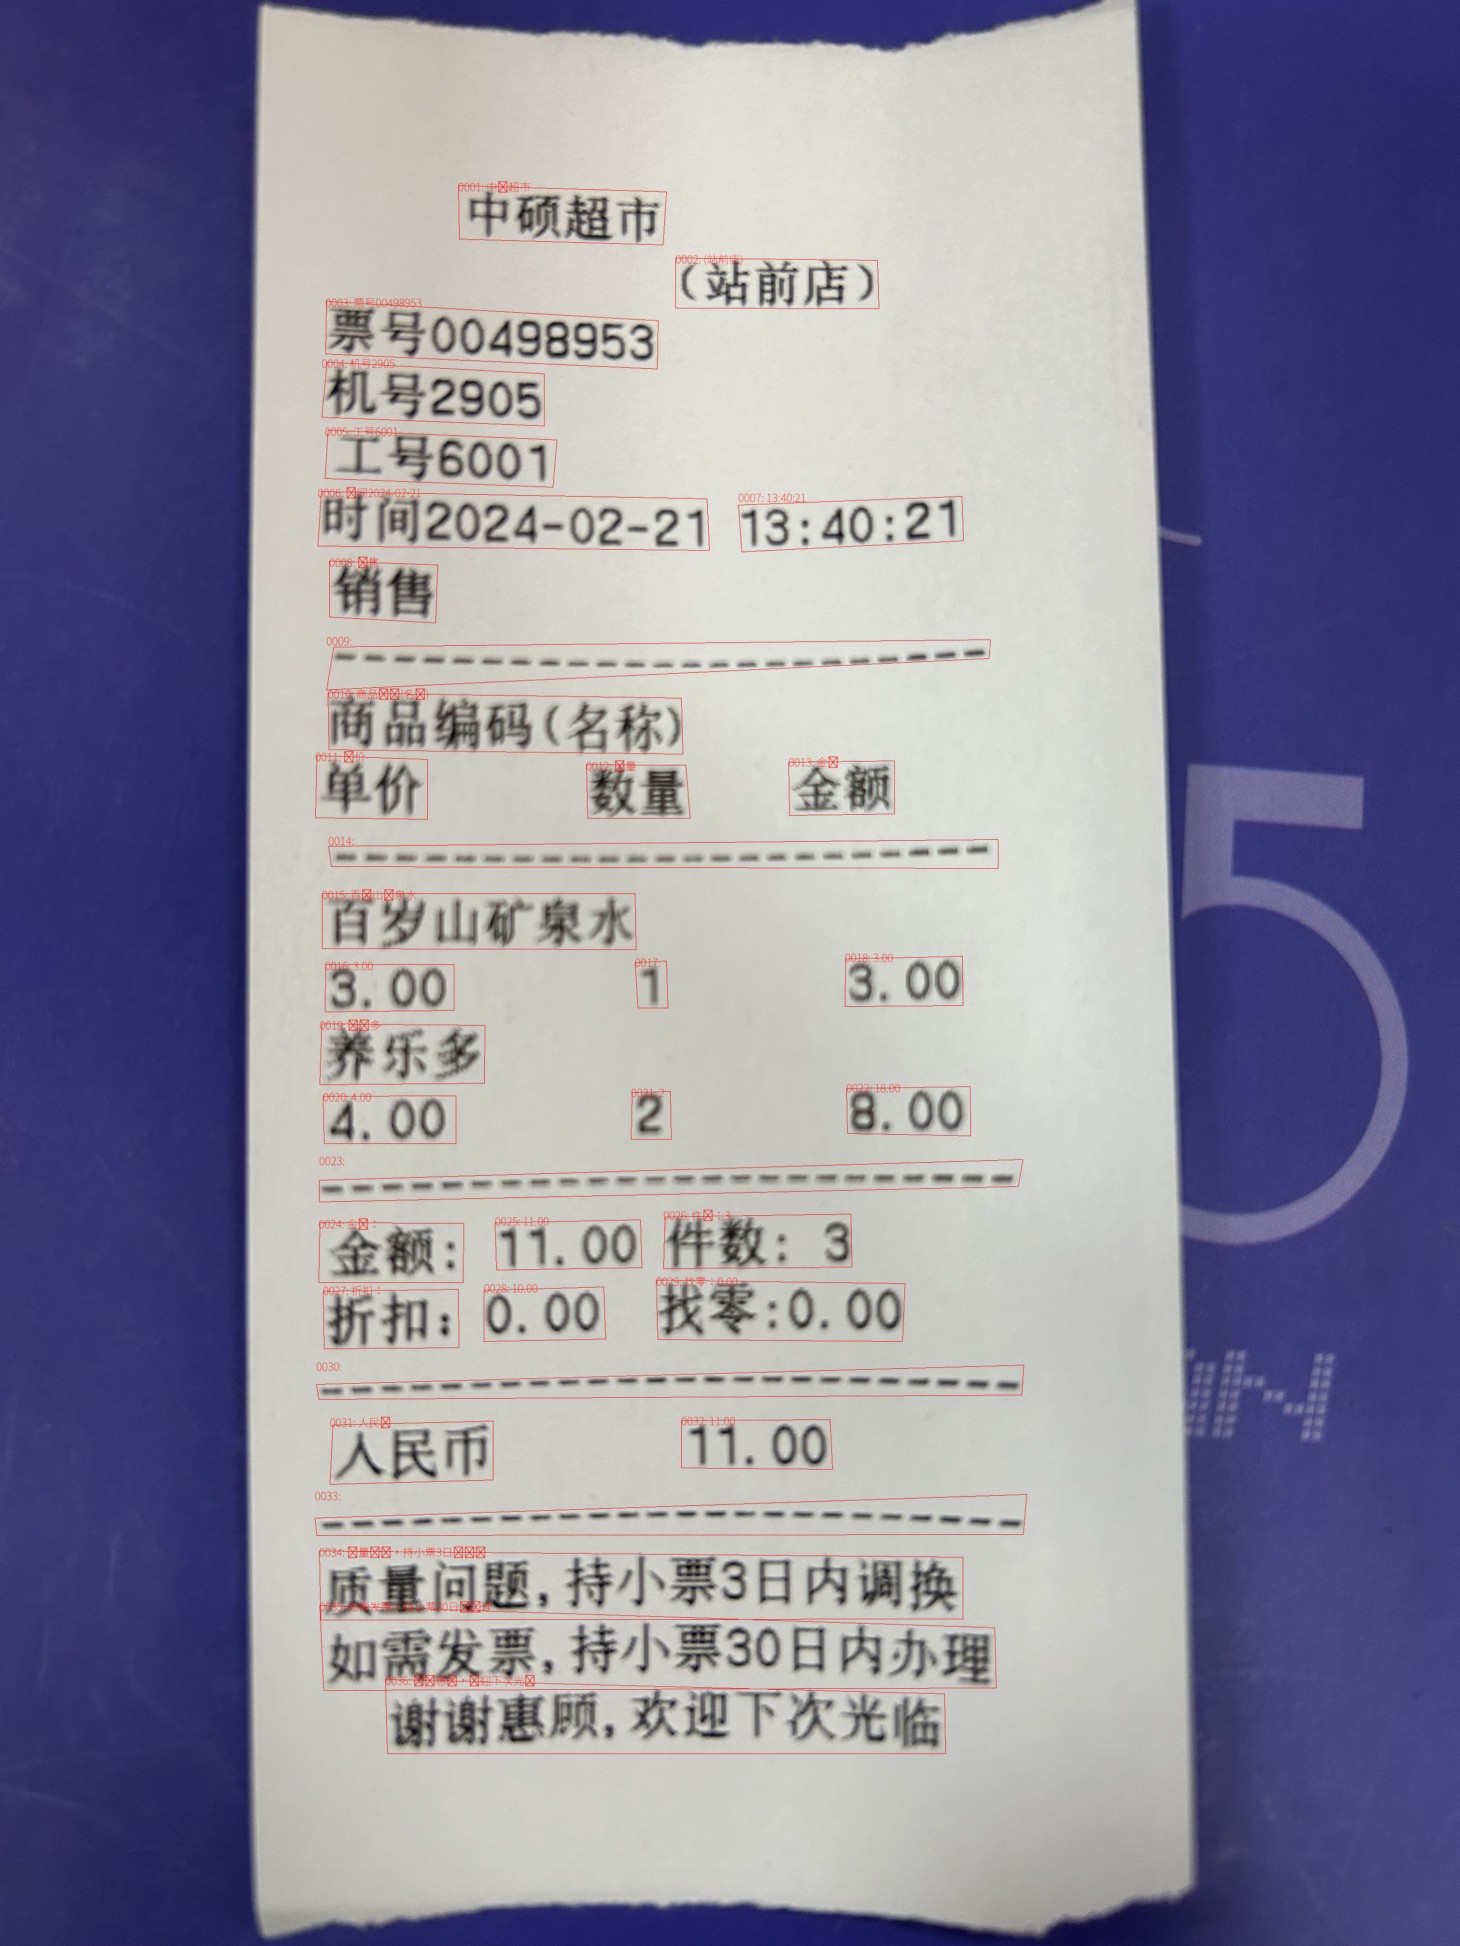
OCR Example2
Objective: Improve OCR performance for multilingual receipts (Chinese, Japanese, Thai, Vietnamese) purely through Data Preprocessing (Model architecture fixed).
- Metrics: DetEval (F1 Score)
- 🎯 My Role:
- Data Labeling & Cleaning: Manually corrected orientation issues and removed noise from the Ground Truth labels to improve data quality.
- Visualization: Developed a Streamlit dashboard to visualize data distribution and augmentation effects for the team.
- 🛠️ Methods:
- Dataset Expansion: Integrated external datasets (ICDAR, CORD).
- Augmentation: Applied Perspective Transform and various noise injections (Gaussian, Salt & Pepper).
-
📊 Result: Achieved F1 Score 0.8100 (Public) / 0.8078 (Private).
- Performance Comparison (Before vs. After Ensemble)
| Stage | Model / Setting | Epoch | Precision | Recall | F1 Score | Key Configuration |
|---|---|---|---|---|---|---|
| Before | Version 1 | 150 | – | – | – | translate (50%), salt & pepper (50%), add line (50%) |
| Version 2 | 150 | 0.7734 | 0.7032 | 0.7366 | translate (50%), gaussian (50%), add line (50%) | |
| Version 3 | 150 | 0.5503 | 0.5088 | 0.5288 | translate (50%), salt & pepper (35%), gaussian (35%), add line (50%) | |
| Version 4 | 150 | 0.6855 | 0.6681 | 0.6767 | rotate 90° | |
| After | Final Ensemble Model | – | 0.81+ | 0.80+ | 0.8100 (Public) / 0.8078 (Private) | Hard Voting Ensemble (Optimized IoU & Vote Thresholds) |
- Summary
After applying an optimized ensemble strategy, the F1 score improved from a maximum of 0.7366 (single model) to 0.8100 (Public) and 0.8078 (Private), demonstrating a balanced improvement in both precision and recall.
4. Bone Segmentation
This Streamlit app was developed to provide detailed, step-by-step visualization of hand bone segmentation examples.
Objective: Develop a segmentation model to precisely identify bone areas in medical X-ray images.
- Metrics: Dice Score
- 🎯 My Role & Technical Approach:
- Library Comparison & Data Workflow: Conducted analysis of folder structures and performed detailed data EDA, then refactored the pipeline for efficient data preprocessing and augmentation using various libraries.
- Encoder Experiments: Analyzed performance differences between Transformer-based encoders and CNN-based encoders.
- Troubleshooting: Resolved weight initialization errors (
encoder_weights: None) and decoder compatibility issues.
- 🛠️ Methods:
- Model Architecture: Found that U-Net provided more stable performance on medical data compared to DeepLabV3+ or U-Net++.
- Hyperparameter Tuning: Optimized Image Size and Epochs using WandB Sweeps.
- 📊 Result:
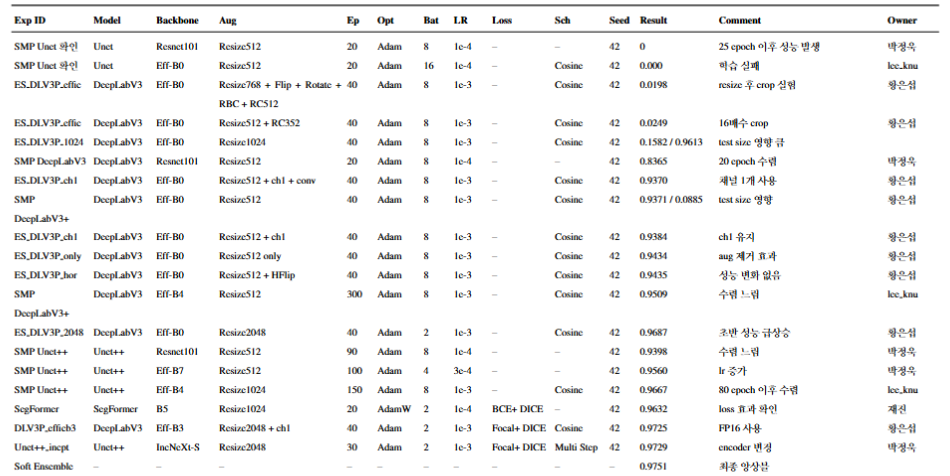
Finally, the best result was obtained by combining high-resolution inputs with attention-enhanced decoding and a soft ensemble strategy, achieving a Dice score of 0.9751 on the test set.
📸 Commemorative Photos